Often in programming it is useful to represent the features of the program in picture form. This technique is often called a Flow Chart.
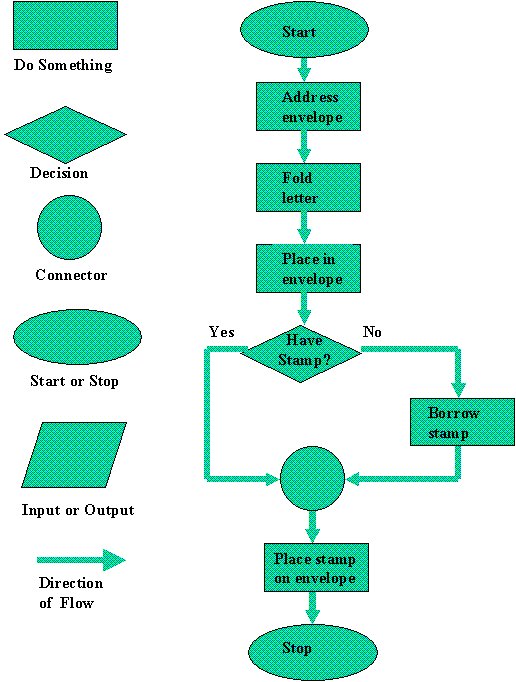
Usually there are several shapes for types of events
Inside the shapes are written the idea of the event.
Flows from event to event are shown as arrows or lines, which lead to other shapes in the flow.
When you are trying to get a handle on a problem that will be solved with programming, the flow chart can be useful. It is especially useful when there are a number of people working on a project. The group can chart out the project, then assign individuals to certain pieces of the project as defined by the flowchart.
To draw a flow chart, you can use:
Here are some links
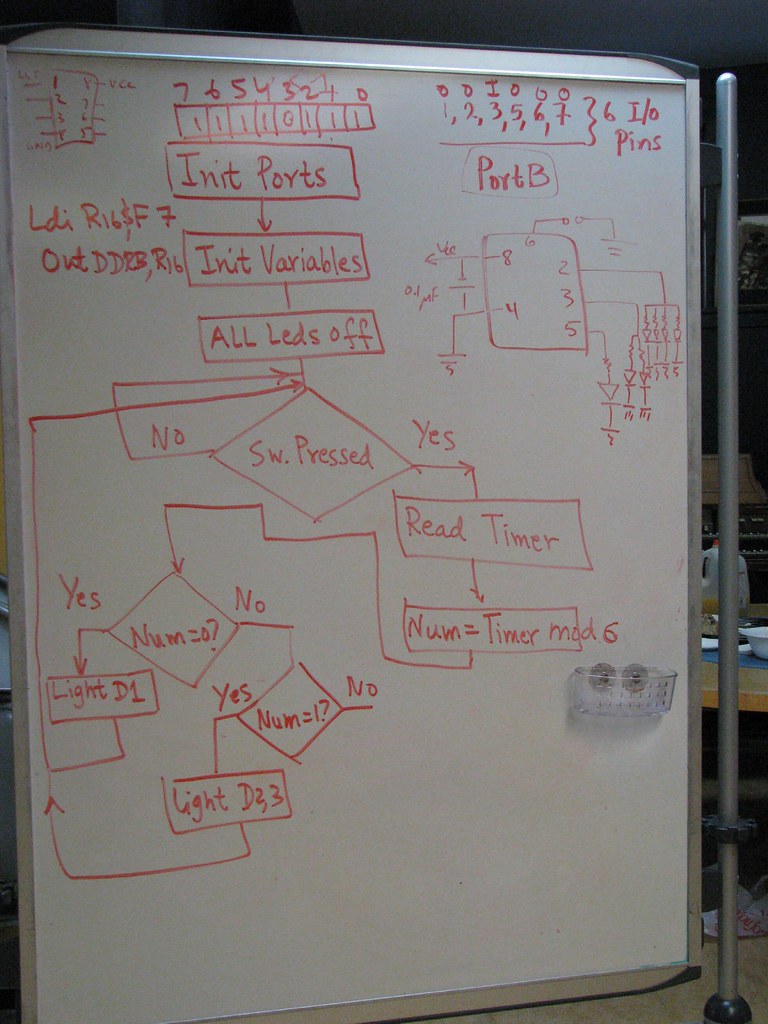
Photo of a flowchart for programming a set of electronic dice link - with some electronics notes
wikipedia entry - http://en.wikipedia.org/wiki/Flowchart
online flowcharting applet - http://www.edutoolresearch.com/IconicProgrammerApplet.html
Open office Draw - http://www.openoffice.org/product/draw.html
Universal Modeling Language (UML) - http://en.wikipedia.org/wiki/Unified_Modeling_Language and http://www.uml.org/
Flow chart image with symbols - http://homepage.cs.uri.edu/faculty/wolfe/book/images/R13/flow1.jpg
Link to the page that the above image comes from - http://homepage.cs.uri.edu/faculty/wolfe/book/Readings/Reading13.htm